Bring it all together.
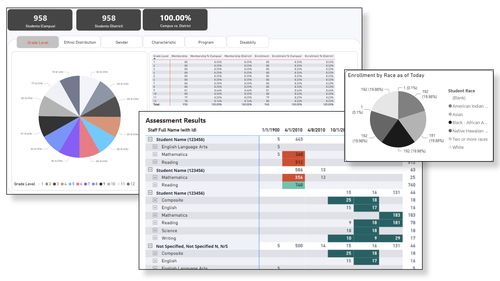
With Ed-Fi making data integration a reality in the education sector, it’s now possible to create real-time visualizations and comprehensive reports. Via EdGraph’s Analytics Platform, districts can support student success and spot troubling trends.

- Enjoy flexible, multi-year reporting and interactive dashboarding.
- Utilize a library of constantly evolving report packs.
- Create powerful, yet simple-to-use custom reports to suit your district’s specific needs.
- Use familiar tools (such as Microsoft's Power BI) to interact with EdGraph's intuitive and proprietary Semantic Model.
- With no coding experience required, build custom reports based on natural-language fields and click-and-drag interfaces.
- Gain insight into disparities within individual student populations.
- Report on historical data, allowing for detailed troubleshooting of trends over time.
- With everything in one place, finally obtain a full 360-degree view of your district/student data.

